Each Monday Bay Cycles hit the Venning Ride studios for a high octane indoor cycling session. In this series of articles I’ll be looking at the wealth of data to be gleaned from the Stages Power bikes to help you understand how to get the most out of this great opportunity to train with power.
Comparing Workouts
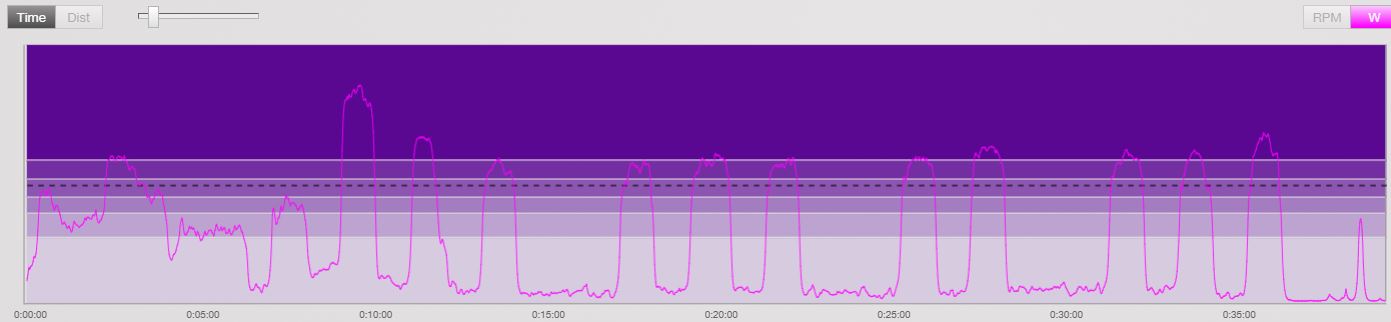
Here I am going to compare Lisa’s efforts this week with her ride the week before, in an effort to find out if she trained harder! You might want to look at last weeks article to understand some of the things I will talk about like ‘threshold’ etc. Lets start by putting graphs of her power with zones in the background from last week and this week side by side.

Number of efforts
The first thing you might notice is how different the two sessions look. In week 1 there were lots more spikes. There were 12 really big efforts above threshold (the dotted black line) in week 1. In week 2 there were only about 6, with a couple more times where the effort just sneaked over threshold.
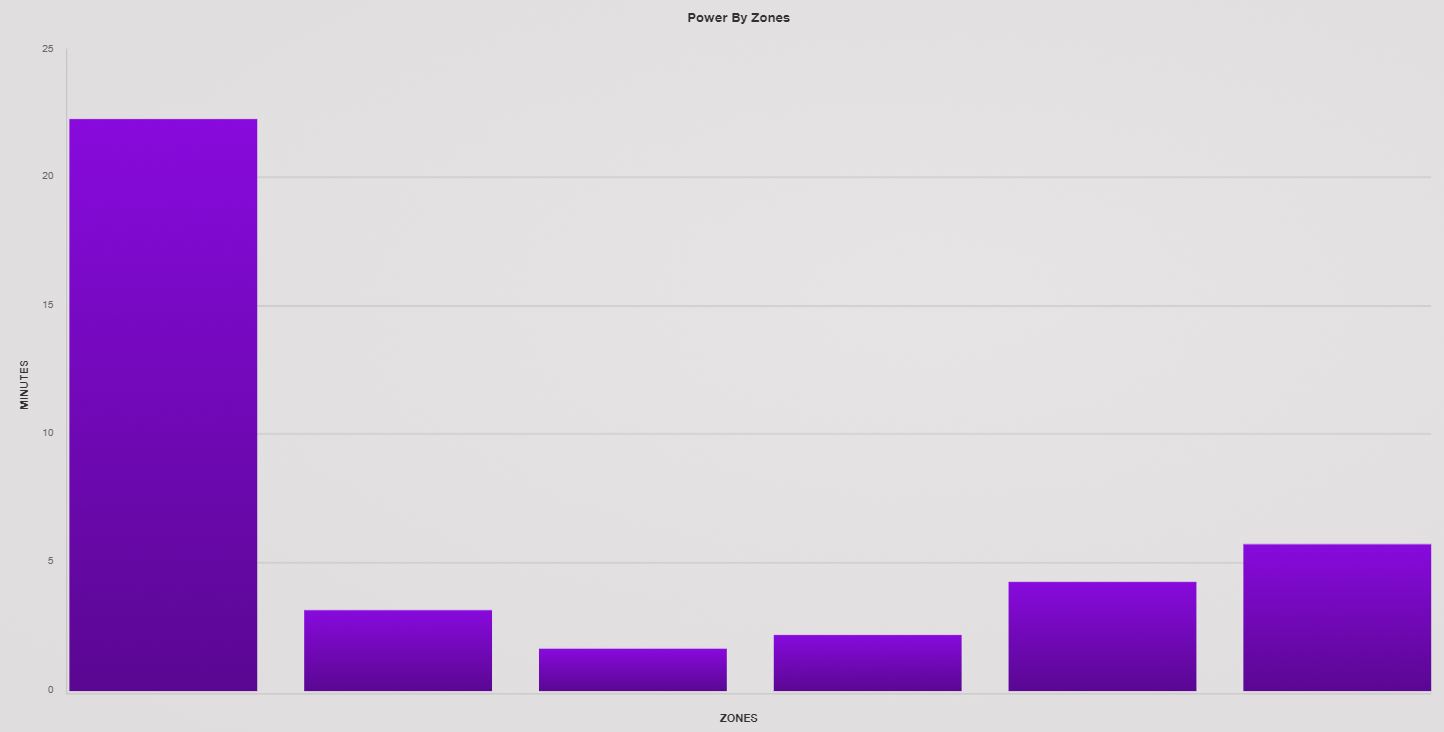
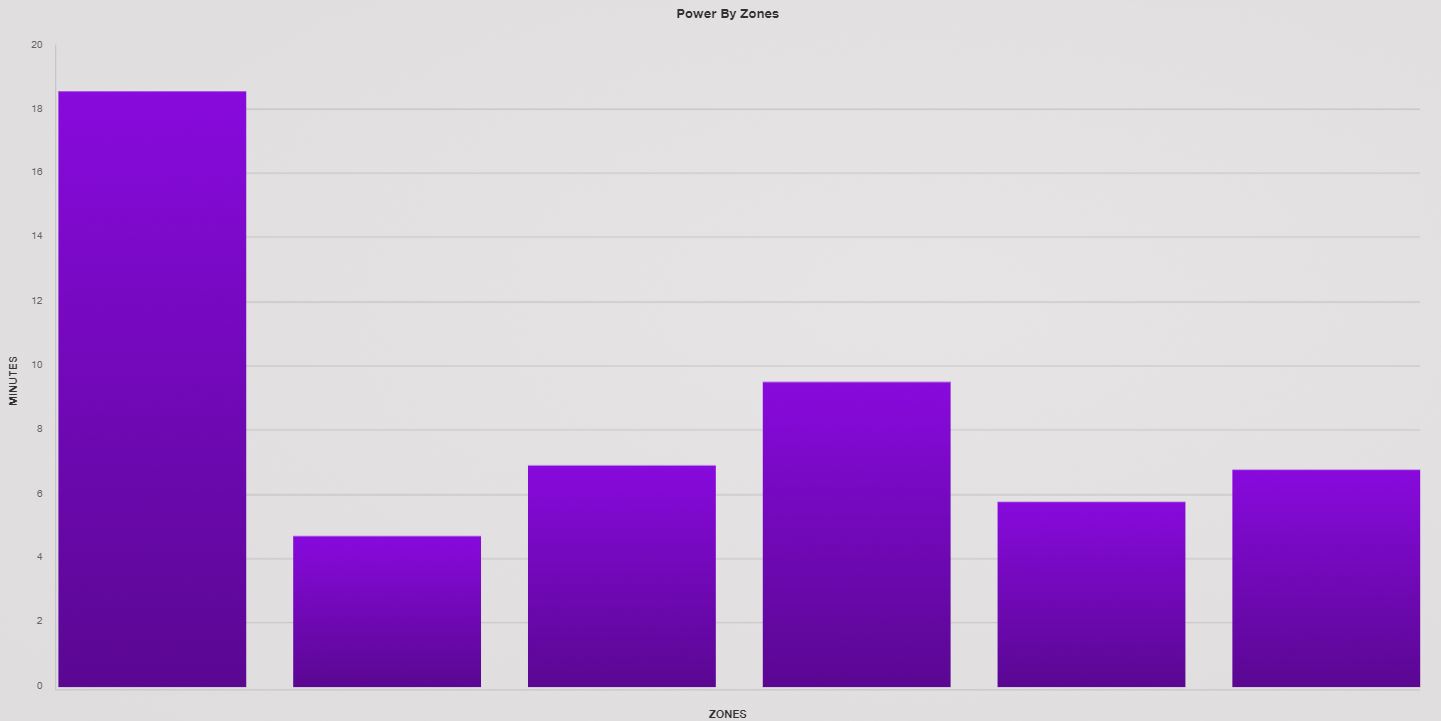
So does that mean that in week 1 Lisa tried harder? Not necessarily – it means in week 1 Lisa made more efforts above threshold but we also need to consider how long the efforts lasted. So lets look at another pair of graphs showing ‘Time in Zones’;
Time in Zones
Again you’ll notice the graphs are quite different, BUT in terms of those efforts above threshold, time spent in zones 5 and 6 was remarkably similar. In both weeks Lisa spent 11% of her time in zone 5 and 13% against 15% in zone 6. The session was a little longer in week 2 so in actual fact Lisa spent a little more time above threshold in the second week – so in this particular way, Lisa trained a tiny bit harder in week 2.
Sustainable Power
Where these graphs really differ is in the time spent in Zone 4. This zone is also known as ‘Threshold’ as it is the zone just below and just above threshold. The nature of this session (week 2) was to work much more around threshold (zone 4). Training in this zone, unsurprisingly, helps to improve your threshold (FTP and/or Lactate Threshold) which is basically your sustainable power. You can clearly see that more time was spent at or very close to threshold in week 2 on both of these pairs of graphs. This is a tough zone to work in and fantastic for boosting sustainable power, so again, week 2 was a harder session in this way too.
Overall Intensity
Last week I introduced Intensity Factor (IF) which measures the overall intensity of a workout relative to your threshold (FTP). In week 1 Lisa’s IF was 0.90 which means she averaged 90% of her threshold for the whole workout. A hard session! We’ve seen how this weeks session has been harder at threshold and above, so I’d expect to see the IF even higher this week. In fact it was a huge 0.98, ie 98% of her threshold on average! This is an exceptionally high effort level, so kudos to Lisa for giving it everything! What this also suggests is that Lisa’s threshold has risen since we calculated it – a sign of her fitness improving.
Training ‘Stress’
I’m going to finish this week by adding in one other way to compare our efforts from one workout to another – TSS or Training Stress Score. Every time we train we ‘stress’ the body. The body reacts to this stress by rebuilding and getting just a little stronger for next time. This is how training works to make us fitter, stronger and faster – Train (stress the body), Recover (the body gets stronger), Train (ride again and stress the body more), Recover (get a little stronger) and so on. TSS is a way to measure this stress. It is useful so that we can build up our fitness over time, and also because too much training stress will only make us excessively fatigued to a point where our fitness will decline.
Training Stress Score is a combination of both the amount of time you train and the intensity at which you train. So training for longer and/or harder will give you a higher TSS. So, for one final confirmation that Lisa trained harder in week 2 we can look at her TSS. In week 1, TSS was 53. It was 84 in week 2! This was down to the session being both a little longer and more intense.
Chapeau to Lisa!
Training Effects
So we’ve looked at a few ways to compare different workouts. Just a word of caution though. The various measures and numbers are really useful and tell us lots about the nature of a workout and how hard a rider has tried. But bigger numbers are not always better. It all depends on your long term aims and goals, and what you are trying to achieve in that particular session. One session is not necessarily better or worse than any other. Rather, each session will have different training effects.
So you can relax a little Lisa, you don’t have to ‘beat’ the numbers you achieved this week. I’m sure Paul at Venning Ride has got another great session lined up for you next week – but that might have a very different goal and improve your fitness in a different way to either of the sessions you have done so far.
Just ride hard and enjoy the Sufferfest!


